Those who Believe in Global Warming Changed the Phrase to “Climate Change” in Order to Deceive the Public

Skeptics accuse those who believe in global warming of having changed the phrase “global warming” to “climate change” in order to deceive the public. They claim that the change was made in order to explain any natural phenomenon other than mere warmth. They also state that this change was relatively recent, although they rarely say when it was made. By saying that it is recent, one could assume that they mean in the last decade at the most.

However, the phrase “climate change” or “climatic change” has been in the scientific literature for almost seventy years. With respect to human-caused climate change, the earliest known scientific papers using the phrase (In the titles) were published in 1956.

Below is a condensed list of scientific papers, from before the year 2000, with the phrase climate or climatic change in their titles:

Continue reading

Posted in Uncategorized | Tagged , , | Comments Off on Those who Believe in Global Warming Changed the Phrase to “Climate Change” in Order to Deceive the Public

Volcanoes Emit More Carbon Dioxide than Humans

According to many Skeptics, volcanoes release more Carbon Dioxide into the atmosphere than humans therefore, any human release of the gas is trivial and does not contribute to Global Warming. However, according to the United States Geological Survey (USGS), humans emit much more CO2 than volcanoes. They state:

Which emits more carbon dioxide (CO2): Earth’s volcanoes or human activities? Research findings indicate unequivocally that the answer to this frequently asked question is human activities. However, most people, including some Earth scientists working in fields outside volcanology, are surprised by this answer. The climate change debate has revived and reinforced the belief, widespread among climate skeptics, that volcanoes emit more CO2 than human activities [Gerlach, 2010; Plimer, 2009]. In fact, present-day volcanoes emit relatively modest amounts of CO2, about as much annually as states like Florida, Michigan, and Ohio. – EOS, Transactions, American Geophysical Union, Volume 92, Number 24,  June 14, 2011 Pages 201-208

volcanic emission of CO2

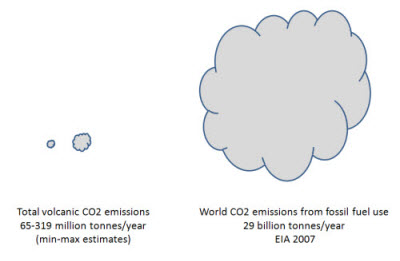
Figure 1: The proportion of volcanic emissions of CO2 (Small gray illustration) compared to human emissions (Large gray illustration). Courtesy of Skeptical Science.

Also, this article in Scientific American says:

According to the U.S. Geological Survey (USGS), the world’s volcanoes, both on land and undersea, generate about 200 million tons of carbon dioxide (CO2) annually, while our automotive and industrial activities cause some 24 billion tons of CO2 emissions every year worldwide. Despite the arguments to the contrary, the facts speak for themselves: Greenhouse gas emissions from volcanoes comprise less than one percent of those generated by today’s human endeavors.

Posted in Uncategorized | Tagged , , | Comments Off on Volcanoes Emit More Carbon Dioxide than Humans

The Sun is Responsible for Global Warming

Some Skeptics have said that the sun has been getting hotter and is responsible for global warming. Actually, the sun cooled off drastically starting in 2002. It bottomed out in 2009 and started going back up to average since 2010. Then in 2015, it cooled once more. In spite of that, global temperatures did not go down. When the temperature chart below is compared to the sun’s cycles, the two do not match. This indicates that the sun has no impact on the upward trend of temperatures.

Figure 1: PMOD, A solar luminosity chart. Note the downward trend in recent years.

Figure 2. Remote Sensing System (RSS) temperature chart. Note the upward trend.

Continue reading

Posted in Uncategorized | Tagged , , | Comments Off on The Sun is Responsible for Global Warming

It Is Only A .8 Degree Increase

According to Patrick Lynch of NASA in 2011:

Based on [James] Hansen’s temperature analysis work at the Goddard Institute for Space Studies, the Earth’s average global surface temperature has already risen 0.8 degrees Celsius (1.4 degrees Fahrenheit)* since 1880…

Those figures seem to understate the gravity of the situation since the number 1 is instinctively considered to be a small number. However, this temperature is a statistical average when spread out evenly throughout the whole earth. It is much more concentrated in some parts of the world, which is causing a chain reaction of events that create severe weather disruptions throughout the rest of it.

Figure 1: NASA’s GISS temperature anomaly map of the earth for September 2024.

Note: If map above does not appear in your browser go to https://data.giss.nasa.gov/gistemp/maps/index_v4.html and search under month and year.

The temperatures, as shown in the anomaly (Change in average) map above, show an average increase of 1.24 degrees Celsius (2.23 Fahrenheit) for September 2024. Portions of the Earth reached 6.5 Celsius (11.7 Fahrenheit)* above average compared to the baseline period of 1951-1980.

Continue reading
Posted in Uncategorized | Tagged , , | Comments Off on It Is Only A .8 Degree Increase