
According to Patrick Lynch of NASA in 2011:
Based on [James] Hansen’s temperature analysis work at the Goddard Institute for Space Studies, the Earth’s average global surface temperature has already risen 0.8 degrees Celsius (1.4 degrees Fahrenheit)* since 1880…
Those figures seem to understate the gravity of the situation since the number 1 is instinctively considered to be a small number. However, this temperature is a statistical average when spread out evenly throughout the whole earth. It is much more concentrated in some parts of the world, which is causing a chain reaction of events that create severe weather disruptions throughout the rest of it.
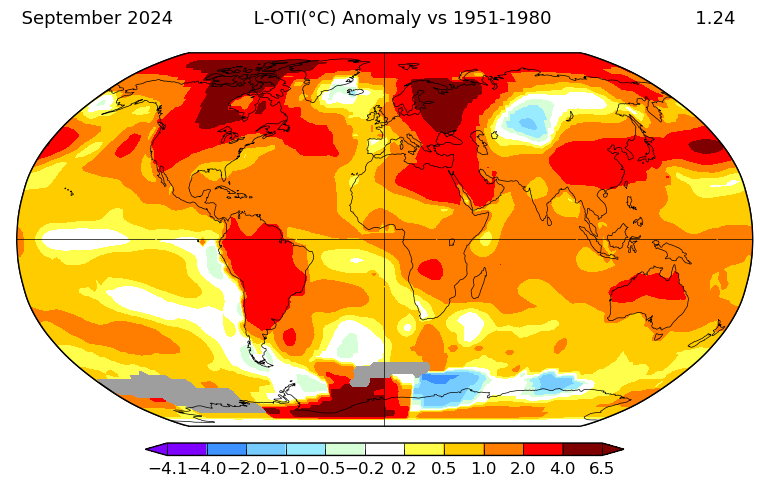
Figure 1: NASA’s GISS temperature anomaly map of the earth for September 2024.
Note: If map above does not appear in your browser go to https://data.giss.nasa.gov/gistemp/maps/index_v4.html and search under month and year.
The temperatures, as shown in the anomaly (Change in average) map above, show an average increase of 1.24 degrees Celsius (2.23 Fahrenheit) for September 2024. Portions of the Earth reached 6.5 Celsius (11.7 Fahrenheit)* above average compared to the baseline period of 1951-1980.
*Each degree Celsius is 1.8 degrees Fahrenheit.
